A deeper look into a marathon preparation
Posted on July 16, 2019At the end of 2018 I began the planning of my second marathon in early 2019. After my marathon debut in Adelaide in 2018, which saw me finish in a time of 2.35:57, my interest in preparing for the long road race increased. While I feel I got a fair bit out of myself in Adelaide I felt with my minimal history of good mileage, I could comfortably improve that time in 2019.
I entered the Tokyo Marathon in March 2019, and off the back of a 10,000m PB by almost 90seconds at the Steigen Spectacular in December 2018 (31.28), I was confident of running under 2.30 in Tokyo. However, to keep a long story short, running is a tough game and while we can reduce risk of injury with good habits and decision making it’s tough to suggest anyone can truly prevent injuries from occurring. I perhaps was a little greedy after Steigen with my training load and as a result that cost me a poorly timed calf strain in the lead into Tokyo. Why one would increase their training load after running a PB? Well, for someone who prides himself on great management of load skills… I still managed to make a poor decision that put me onto the road bike for a bit of time.
So, moving on quickly. While the set back was annoying, I decided to take this block of training and extend it out to the Gold Coast marathon (the start of July).
So what did my 6 months from January through the July look like? Well anyone who knows me understands my love for a graph! So I’m going to describe it using some TrainingPeaks data:
Fitness Summary (6 Months)
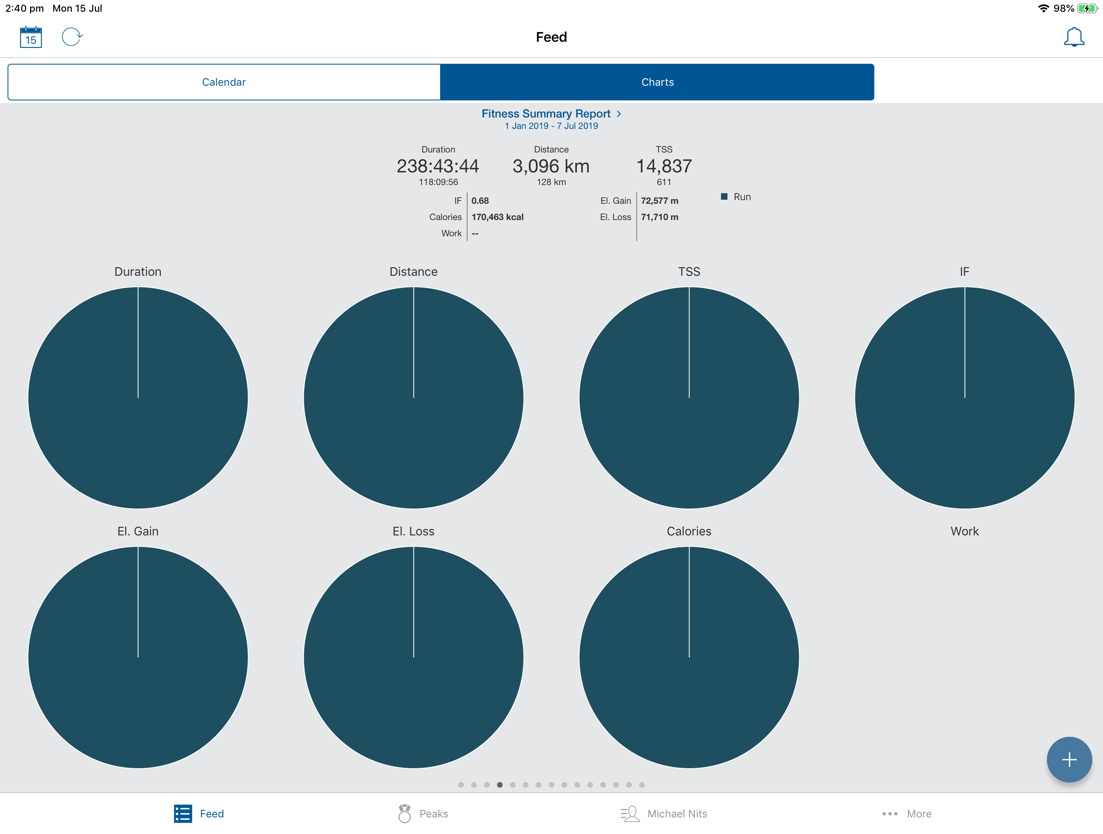
Duration: 238 hours of running (1.25hrs/day) & 3,096km (114km/week). Also note, that elevation is way off.
My volume progressed up towards the Gold Coast marathon, with my maximum weekly mileage around 144km. My biggest 4 week block was about 135km/week average, which is what I felt I could handle with family, work and study commitments.
Running Workload
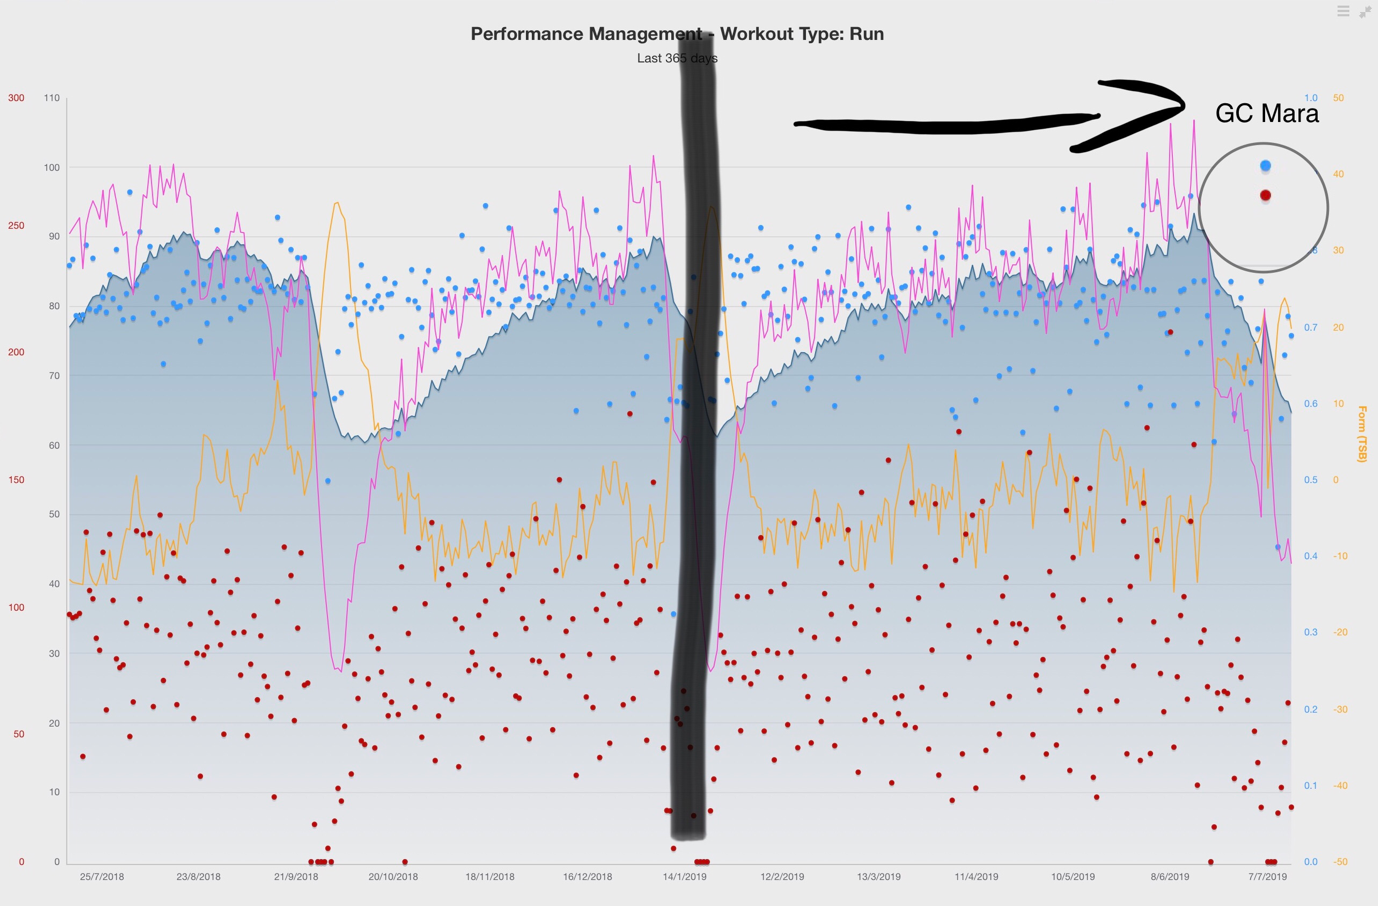
This colourful graph describes the workload of my running training (365 days). I’ve just placed a clear black line through the day I strained my calf and began to build to Gold Coast marathon (last 6 months).
What do all the bibs and bobs mean:
- Red Dot = a running training stress. The stress is calculated by the duration of a run x relative intensity (relative pace in this case). The really high red dots are usually longer durations of stress (long runs). You can see a few more of these approaching the marathon, in which that red dot is magnified
- Blue Dot = how ‘relatively’ intense that day was (once again pace was used)
- Blue line = Fitness. The sum of training stress points over a month
- Pink Line = Fatigue. The sum of training stress points over a week
- Yellow Line = Form. The balance between my fitness and fatigue
Basically this graph describes the amount of objective workload I managed over the 6 months. Only a few red dots are on the ground (day off running). Unfortunately there were a couple close to the marathon itself due to soreness from some of those long hard runs I put emphasis on in the last 6 weeks (e.g. you can see a couple small spikes in the pink line). However, this is a relatively consistent training block for my history.
How I spent my 238 hours of training (Training Intensity Distribution)
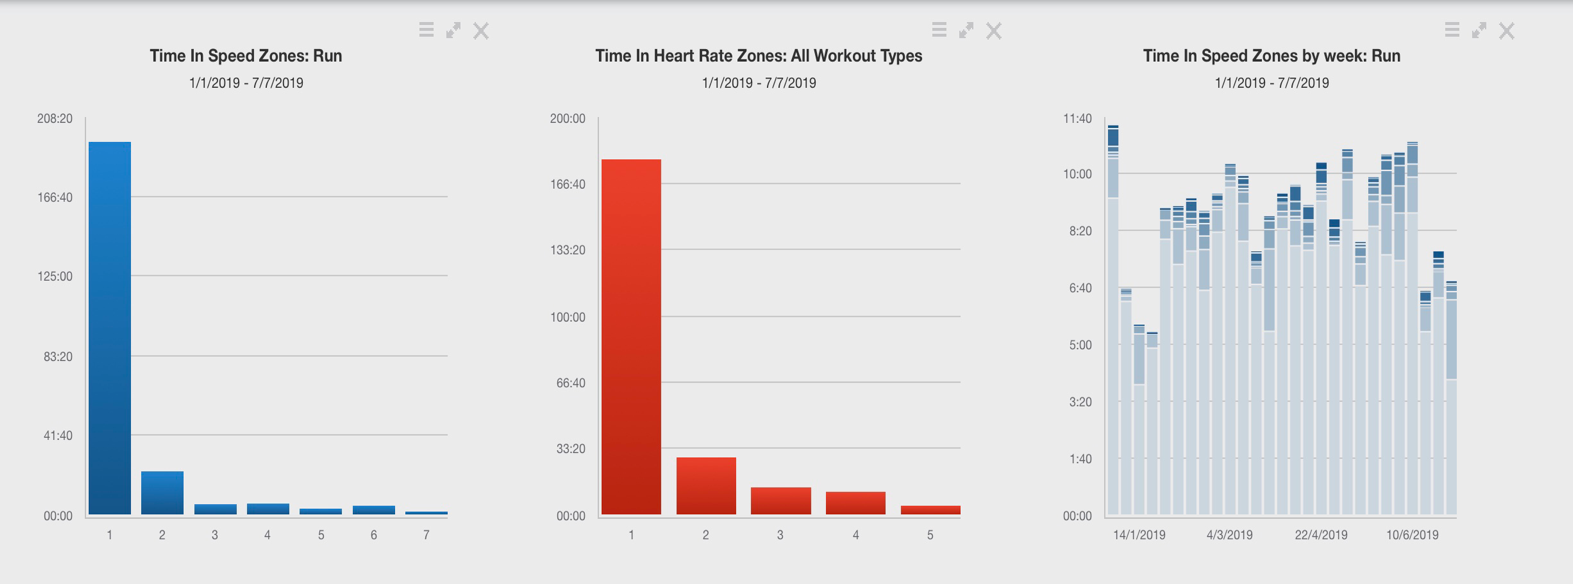
So these graphs tell me how I distributed my effort throughout the 6 months of training duration.
Graph 1 (left) shows the hours spent in my relative pace zones. I work this out by creating an ‘estimate running threshold pace’ from a previous race performance (in this case I used my 10km time from Steigen). Zones 1-2 are easy pace zones (jogging and faster jogging), zone 3-4 moderate pace zones (tempo/threshold runs) and zones 5+ are fast zones (repetitions and sprinting). A lot of my time was spent jogging/running easy (80-85%).
Graph 2 (middle) this shows the time spent in heart rate zones (relative to an estimated, but practically accurate threshold heart rate). This pair of graphs show that my training intensity distribution model was Pyramidal (more on that in a future blog), which basically means I spend most time running Easy > Threshold > High intensity.
Graph 3 (right) shows the distribution of my duration spent at relative paces through each week. The lighter blue colours represent easier running and the darker colours represent faster running. In the most of May/June, I spent a lot more time sessioning in the threshold zones of pace (moderate blue), however prior to this (march/April) I completed sessions more at High intensity (Dark blue) leading into the Sydney 10k road race (early may) where I ran a PB of 31.23.
How did the race go?
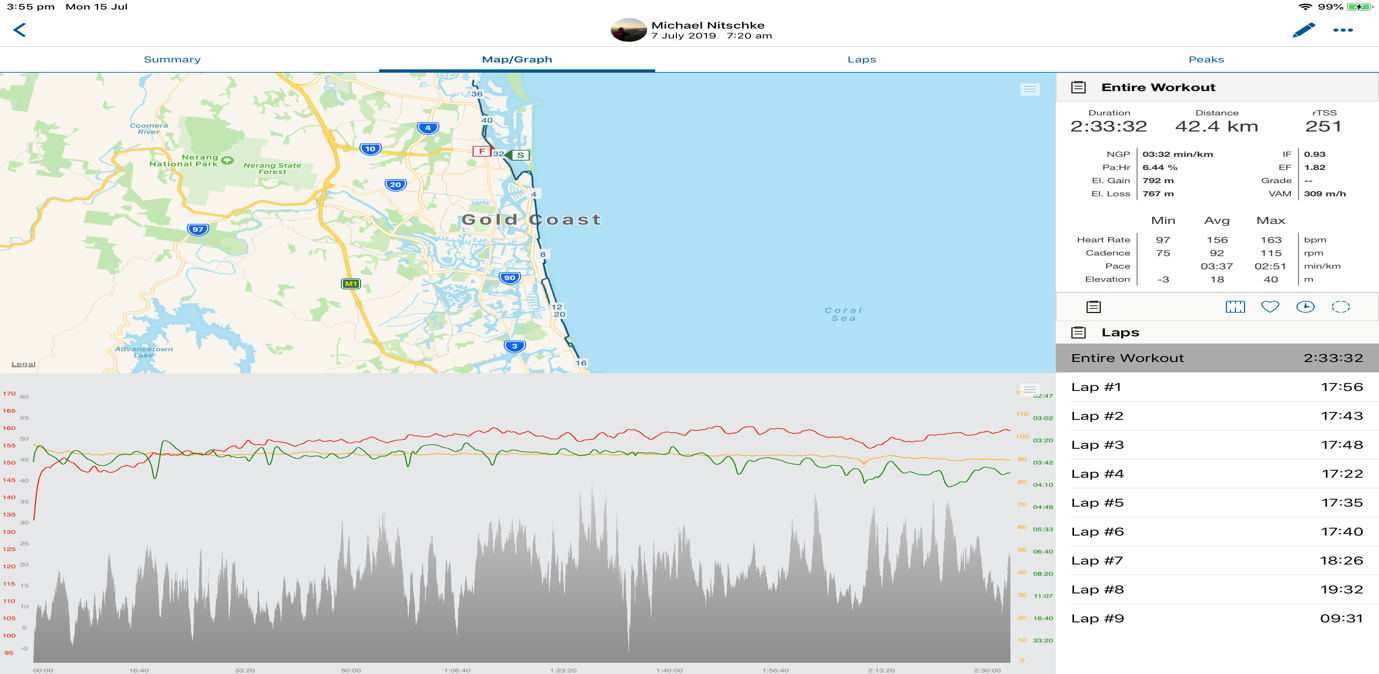
Well, my interest in preparing for a marathon has probably further increased from this experience. The marathon went well, until it didn’t. That old cliché saying “I just was happy to finish in the end” sung very true late in this race. The graph shows my pace (green), heart rate (red) and cadence (yellow) and on the right my 5km splits. You can see that vital green line starts to sadly head south in that last 40 minutes.
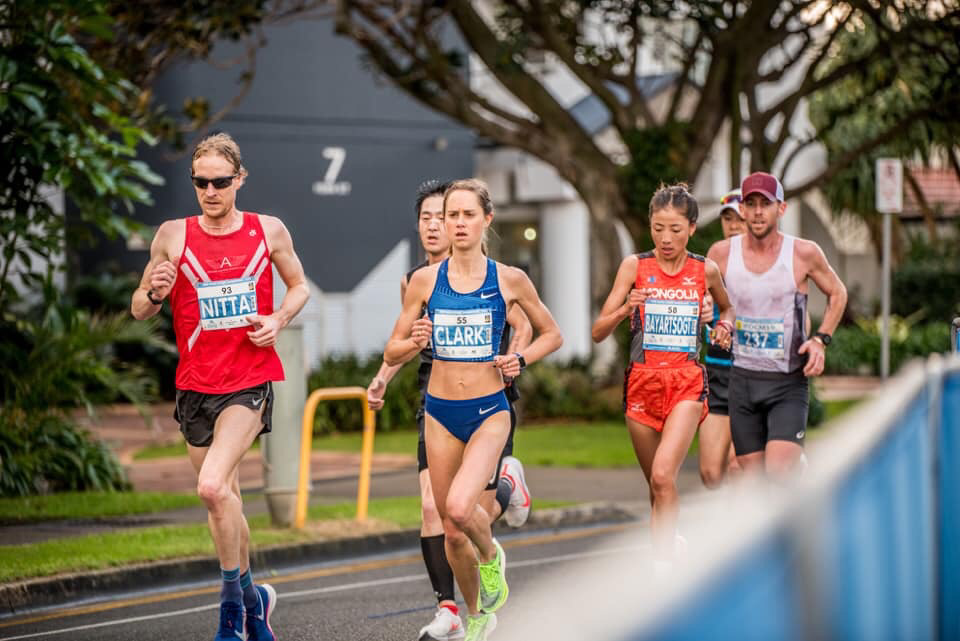
The first 10 miles was into a head wind (not excessive though) but it went to plan in terms of both pace and effort. At the turn around point, we had a decent pack that began to splinter and I followed the pace of the leading Aussie female Milly Clarke. My effort from 15-20km may have been too fast (although I perceptually felt fine). I went through half way in 1.15.04 and felt very good, and the plan was to sneak home a little quicker if possible. From that half way point I was solo, as Milly put on the after burners and went on for a historic run (2.28). At 25km I felt in control and Hi-fived my harriers team mates, and felt in control. However at 30km onwards things began to go downhill. Similar to my Adelaide experience, I started to get cramps in both hamstrings and my calves. However, unlike Adelaide, these cramps got severe and required to stop and stretch a couple times between 34-38km. I found a bit of a shuffle gait and just dealt with the cramps of the way home and slowed to run the second half in 78+, to complete the marathon in 2.33:35 (2:22 faster than Adelaide).
Cramping isn’t a lot of fun, but your body is quite clever and can work out an efficient enough sort of gait to get around it, it’s just a poor gait. My heart rate obviously lowered, as I couldn’t run the desired pace or produce the effort I wanted. There are many plausible explanations for cramp, with conditioning and preparation probably sitting up the top of the list. I’m unsure if my body has done the work to handle the mechanical loading required for a sub 2:30 marathon yet? However, GC gets quite warm from 30km onwards and perhaps I didn’t take on enough fluids along the way in the early days when we were getting rained on? It may be as simple as that the cramps could have been forced through more than I did, and I’m just a little soft. I’m guessing it’s a combination of all of the above.
I was definitely conditioned better for this marathon compared to Adelaide, but perhaps I ran a more balanced race in Adelaide and got more out of my conditioning. While it’s disappointing to miss a sub 2:30 it was a great experience. At 33, and 20 years of running experience, PB’s are harder to come by so you learn to appreciate them when they pop up!
What did i learn and what will i change?
Well I learnt that the marathon is unique compared to other events, and this race wasn’t remotely the same experience as the first. Experience and history in both the conditioning phase and execution of the race are extremely important. I need to just prepare and race more marathons. The data above is really fun, but like any data analysis it’s best used to ‘describe training habits as opposed to prescribe training habits.’ However, the data gives good insight into my preparation, but like most events that endure, your build up and race probably is better performed following your intuition which you gain from experience.
In the marathon the body’s isn’t just resisting fatigue physiologically, it’s resisting progressive fatigue from the mechanical trauma of pounding over the long duration and this is a highlighted issue for myself, and I think this will just take more ‘time’ develop. Of course, the mind obviously plays a big role in resisting fatigue in that last 30-45 minutes and this is the challenge I am looking forward to in the future and hopefully gets better with experience also.
I probably won’t change a lot of my conditioning except for perhaps just doing more work and place a stronger focus on my subjective fatigue more than my objective numbers, as that definitely predicted my soreness/illness in this block of training. I will follow up some dietician advice to see if anything is possible from that side to tackle the cramps…however, the next marathon I’ll run will definitely be a colder one! I definitely prefer the cold conditions, running related or not running related! Until then, I’ll be trying a recover with jogging slowly for 3-4 weeks then go chase some shorter PB’s while focusing more on work and my Post Grad studies!
You can follow my running journey on Strava:
https://www.strava.com/athlete...
Nitta